DESK REVIEWS | 02.01.02. The private health sector![]()
DESK REVIEW | 02.01.02. The private health sector

The private health sector has been an important part in the provision of care in Brazil and is spread across the country. The private healthcare sector connects with the public sector by providing services contracted-out by the SUS, out of pocket hospital, and ambulatory services, drugs, and through private health plans and insurance. Private healthcare services are financed both by the SUS and private sources. Data from the report “Fiscal Aspects of Health in Brazil” state that 55% of the total expenditure in health comes from private expenditure/sources and 45% comes from public expenditure/sources (Brazilian National Treasure, 2018; OPAS/OMS, 2019).
It is important point out that over 70% of the total population do not count on private insurances for their healthcare needs (>190 million people) (Brazilian Ministry of Health, 2013a). A survey conducted in 2018, commissioned by the Credit Protection Service (SPC Brasil) and by the National Confederation of Store Owners (CNDL), showed that, of the 70% who do not hold a health insurance, nearly 45% report to use SUS whenever they need it, while the remaining proportion reports to pay in cash for their healthcare whenever they need it (Agencia Brasil, 2018). Mostly due to the long waiting time for consultations, some people pay for it privately and then do the exams requested by the clinician through the public health system, for example. Also, most people get their vaccinations done through SUS, and may get their medication free of charge also out from the primary healthcare services (Agencia Brasil, 2018).
By the end of 2018, according to the National Regulatory Agency for Private Health Insurances and Plans (Agência Nacional de Saúde Suplementar – ANS), around 23.3% of the Brazilian population had a private health care insurance (National Regulatory Agency for Private Health Insurances and Plans, 2019b). Main users of private health plans are employees from public and private companies that offer private health coverage. The insurances vary in quality and amenities according to socioeconomic and occupational status of the demanders. Within one company, employees may have different levels of health care coverage depending on occupational hierarchy. Even though people with private health care insurance might benefit from more “premium” health plans, they often receive vaccines, high-cost, and complex services through SUS (Paim et al., 2011).
References:
Agencia Brasil (EBC). (2018, November 5). Tragédia Mariana. Agência Brasil. http://agenciabrasil.ebc.com.br/geral/noticia/2018-11/tragedia-de-mariana-completa-3-anos-veja-linha-do-tempo
Brazilian Ministry of Health. (2013a). Pesquisa Nacional de Saúde 2013: Acesso e Uitlização dos Serviços de Saúde, Acidentes e Violências. https://biblioteca.ibge.gov.br/visualizacao/livros/liv94074.pdf
Brazilian National Treasure. (2018). Aspectos Fiscais da Saúde no Brasil. https://sisweb.tesouro.gov.br/apex/f?p=2501:9::::9:P9_ID_PUBLICACAO:28265
National Regulatory Agency for Private Health Insurances and Plans, M. (2019b). Caderno de Informação da Saúde Suplementar: Beneficiários, operadoras e planos. Março 2019. https://www.gov.br/ans/pt-br/arquivos/acesso-a-informacao/perfil-do-setor/dados-e-indicadores-do-setor/informacoes-gerais/total-cad-info-jun-2019.pdf
OPAS/OMS. (2019). OPAS/OMS Brasil—Países estão gastando mais em saúde, mas pessoas ainda pagam muitos serviços com dinheiro do próprio bolso. https://www.paho.org/pt/noticias/20-2-2019-paises-estao-gastando-mais-em-saude-mas-pessoas-ainda-pagam-muitos-servicos-com
Paim, J., Travassos, C., Almeida, C., Bahia, L., & Macinko, J. (2011). The Brazilian health system: History, advances, and challenges. The Lancet, 377(9779), 1778–1797. https://doi.org/10.1016/S0140-6736(11)60054-8

There are 12 private hospitals and 2,146 registered private clinics in Hong Kong (Electronic Health Record Registration Office, 2019) providing hospital service, primary care, and a broad range of specialist services. As of 31st of March 2019, a total of 4,657 hospital beds were provided in private hospitals (Department of Health, 2019b). The Department of Health regulates all private hospitals and clinics under the Medical Clinics Ordinance (Cap.343) on their compliance with relevant regulations by conducting inspections and handling medical incidents and complaints lodged by the public. All Western and Chinese medicine practitioners have to register with the Medical Council of Hong Kong and the Chinese Medicine Council of Hong Kong, respectively (Hospital Authority, 2019a).
Private sector dominates the provision of primary care in Hong Kong, accounting for about 70% of all medical and dental visits (Food and Health Bureau, 2017b). The proportion of the population making use of doctor consultations, hospitalisation, and dental consultations in the private sector in 2016/17 is summarised in Table 2.2 above. Most of the doctor consultations (67.6%), which consisted of 49.5% and 18.1% of Western and Chinese medicine practitioner use respectively, occurred in the private sector. In contrast, only 30.7% of hospitalisation were handled by the private sector (Census and Statistics Department, 2017, December).
References:
Census and Statistics Department. (2017, December). Thematic Household Survey Report No. 63. Retrieved from https://www.statistics.gov.hk/pub/B11302632017XXXXB0100.pdf
Department of Health. (2019b). Health Facts of Hong Kong 2019 Edition. Retrieved from https://www.dh.gov.hk/english/statistics/statistics_hs/files/Health_Statistics_pamphlet_E.pdf.
Electronic Health Record Registration Office. (2019). Electronic Health Record Sharing Sysem: List of Registered Healthcare Provider – Private Clinics. Retrieved 11 October, 2019, from Electronic Health Record Registration Office, HKSAR
Food and Health Bureau. (2017b). Report of the Strategic Review on Healthcare Manpower Planning and Professional Development.
Hospital Authority. (2019a). Clusters, Hospitals & Institutions. Retrieved from http://www.ha.org.hk/visitor/ha_visitor_index.asp?Content_ID=10084&Lang=ENG&Dimension=100&Parent_ID=100421q

About 74% of India’s total health care expenditure is incurred in the private health sector (India Brand Equity Foundation, 2019), a large proportion of this accounts for inpatient care (including advanced diagnostics, major surgical, and critical care services). The formal private providers in India are mostly concentrated in urban areas (metropolitan and bigger cities) and focus primarily on allopathic care (about three-fourths), and on secondary and tertiary care. They operate in both multi- and mono-specialty set-ups (Chokshi et al., 2016).
The formal private health sector in India includes private clinics (usually led by a single doctor or a doctor-couple), poly-clinics nursing homes and private hospitals as well as medical colleges. They range from doctor-owned set ups to those with doctor-manager partnerships to corporate facilities, and from not-for-profit to for-profit national and international ventures. In rural areas the private health sector is relatively unregulated and comprises mostly of non-formal providers and local practitioners.
While the rate of growth of the private healthcare sector is not uniform across India (Hooda, 2015), the private health sector, in general, shows a very rapid growth due to increasing demand (increasing purchasing power of citizens, epidemiological transition, emergence of medical tourism, increasing home health care needs), and supply (increasing number of trained personnel, health technology, policy liberalization leading to increasing foreign direct investment, etc.). The advent of telemedicine and innovative public-private partnership models hold further promises for the growth of the private healthcare industry in India. Simultaneously, there is policy level effort (e.g., the Clinical Establishment Act of 2010 (Ministry of Law and Justice, 2010)) to standardise the private health sector in India.
Proportion that makes use of private sector services:
As per the National Family Health Survey-4 (International Institute for Population Sciences (IIPS) and ICF, 2017), 51% of household were more likely to seek care from the private sector in 2015-2016.
References:
Chokshi, M., Patil, B., Khanna, R., Neogi, S. B., Sharma, J., Paul, V. K., & Zodpey, S. (2016). Health systems in India. Journal of Perinatology: Official Journal of the California Perinatal Association, 36(s3), S9–S12. https://doi.org/10.1038/jp.2016.184
Hooda, S.K., (2015). Private Sector in Healthcare Delivery Market in India: Structure, Growth and Implications. Institute for Studies in Industrial Development Institute for Studies in Industrial Development.
India Brand Equity Foundation. (2019). Healthcare Industry in India, Indian Healthcare Sector, Services. Available from https://www.ibef.org/industry/healthcare-india.aspx
International Institute for Population Sciences (IIPS) and ICF (2017). NATIONAL FAMILY HEALTH SURVEY (NFHS-4) 2015-16 INDIA. Mumbai. http://rchiips.org/nfhs/NFHS-4Reports/India.pdf
Ministry of Law and Justice. (2010). The Clinical Establishments (Registration and Regulation) Act. Government of India. Available from: http://clinicalestablishments.gov.in/WriteReadData/969.pdf

The healthcare infrastructure in Indonesia is dominated by private players. As of 2017, 1,767 out of 2,776 hospitals were privately-owned (Deloitte Indonesia, 2019). After the introduction of the national health insurance programme (JKN), the capacity of the private hospital sector in Indonesia has expanded. Approximately 75% of hospitals contracted by BPJS (social security agency for health) increased the types of services they offer, for instance the number of outpatient and inpatient departments, the number of beds, and investment into equipment (X-ray, CT scan, MRI, and incubator) (Ross et al., 2018).
Key health areas and services include non-communicable diseases (cardiovascular disease diagnosis and management, orthopaedic services, dialysis, cancer diagnosis and management, and chemotherapy), reproductive, maternal and newborn health (antenatal and postnatal services, immunization, family planning counselling and services, obstetric care, C-sections, and neonatal emergency care), tuberculosis services (diagnosis, outpatient and inpatient treatment), and diagnostic tests (X-ray, CT scan, MRI, and GeneXpert).
From 1993 to 2014, the inequality in accessing private hospitals and services has narrowed. In 1993, public and private outpatient care services were utilised at similar level, but private outpatient care utilisation continued to increase until 2014. This includes an increase in utilisation of inpatient care in the private sector by the lowest income group, which in 1993 was virtually non-existent (Mulyanto et al., 2019).
References:
Deloitte Indonesia. (2019). The Clouds Covering the Healthcare Business are not Always Grey: Welcoming the Future of Indonesia’s Healthcare Business in 2019. In Deloitte Indonesia Perspectives (Issue September).
Mulyanto, J., Kringos, D. S., & Kunst, A. E. (2019). The evolution of income-related inequalities in healthcare utilisation in Indonesia, 1993–2014. PLOS ONE, 14(6), e0218519. https://doi.org/10.1371/journal.pone.0218519
Ross, R., Koseki, S., Dutta, A., Soewondo, P., & Nugrahani, Y. (2018). Results of a Survey of Private Hospitals in the Era of Indonesia’ s Jaminan Kesehatan Nasional: Impact of Contracting with National Health Insurance on Services, Capacity, Revenues, and Expenditure. http://www.healthpolicyplus.com/ns/pubs/8224-8400_JKNPrivateHospitalSampleSurveyreport.pdf

PAHO (2017) also notes that there is a large private health sector in Jamaica with primary and secondary care facilities and diagnostic services, such as radiology. In 2015, there were 10 private hospitals with approximately 200 beds. Referrals between the public and private sector facilities remain a feature of service delivery, particularly for diagnostic and therapeutic care.
As in many other developing nations, higher income persons are more likely to access and utilise private healthcare services, while lower income health care users tend to use the cheaper, public health option via primary health centres or relevant programme, with persons moving between sectors based on the severity of their health status.
For example, research using data from the Jamaica Survey of Living Conditions over a fifteen-year period (1993-2007) showed that wealthier Jamaicans with higher incomes utilised 62.2% more private health facilities than poorer Jamaicans. However, the study also estimated that during this time, private health care demand declined from 54.0% in 1989 to 51.9% in 2007, due to economic downturn experienced in the decade before (Bourne et. al., 2010).
References:
Bourne, P., Denise, E.-S., Paul, T. J., LaGrenade, J., & Charles, C. A. (2010). Public and private health care utilization differences between socioeconomic strata in Jamaica. Patient Related Outcome Measures, 81. https://doi.org/10.2147/prom.s11868
PAHO. (2017). Salud en las Américas+, Edición del 2017. Resumen: panorama regional y perfiles de país. Available from: https://iris.paho.org/handle/10665.2/34322
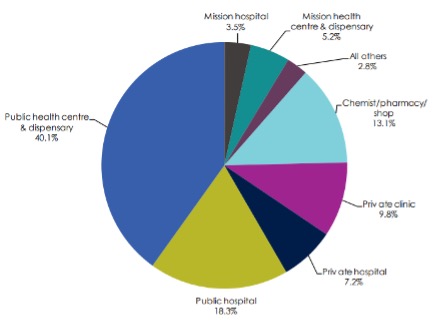
The percentage of individuals accessing private clinics and hospitals for outpatient services in general was 17% compared to over 58% in public facilities in 2013 (figure 1). However, there is a slightly higher dependence of private facilities in urban areas compared to rural areas (Ministry of Health, 2014a). Public outpatient visits was prevalent (66.7%) in rural areas followed by private health facilities visits (23.5%), whereas in urban areas, the visits were nearly equally distributed in both public (44.1%) and private (43%) health facilities (Ministry of Health, 2014a).
The quality of care provided in the privately owned facilities (visited by the middle or high socio-economic status individuals) is better in terms of drug availability and services provided including client focus and responsiveness, compared to that provided in public facilities or unlicenced private care facilities (used by the lower socio-economic statius individuals) (Berendes, Heywood, Oliver, & Garner, 2011). The huge disparities in health care service utilization is mainly due to differences in living standards, levels of education, household characteristics and expenditure (Ilinca et al., 2019).
Figure 1: Proportion of individuals accessing outpatient health services, 2013
The private sector is the largest employer of healthcare professionals in Kenya and has a private healthcare market of KES 20.7b (Barnes et al., 2010). The specific health care providers include informal health care providers such as traditional healers and faith healers; and Formal health care providers (disease-specific specialists, medical doctors, clinical officers and nurses) (Barnes et al., 2010).
Private health facilities are distributed all over the country with majority being medical clinics (2098), dispensaries (196) and nursing homes (150) (Ministry of Health, 2012).
References:
Barnes, J., O’Hanlon, B., Feeley, F., McKeon, K., Gitonga, N., & Decker, C. (2010). Private Health Sector Assessment in Kenya. 193(1). Washington, D.C. https://openknowledge.worldbank.org/bitstream/handle/10986/5932/552020PUB0Heal10Box349442B01PUBLIC1.pdf?sequence=1&isAllowed=y
Berendes, S., Heywood, P., Oliver, S., & Garner, P. (2011). Quality of private and public ambulatory health care in low and middle income countries: systematic review of comparative studies. PLoS Medicine, 8(4). https://doi.org/10.1371/journal.pmed.1000433
Ilinca, S., Di Giorgio, L., Salari, P., & Chuma, J. (2019). Socio-economic inequality and inequity in use of health care services in Kenya: evidence from the fourth Kenya household health expenditure and utilization survey. International Journal for Equity in Health, 18(1), 196. https://doi.org/10.1186/s12939-019-1106-z
Ministry of Health. (2012). Transforming Health: Accelerating attainment of Universal Health Coverage. The Kenya Health Sector Strategic and Investment Plan (KHSSP), (July 2014), 100. http://e-cavi.com/wp-content/uploads/2014/11/kenya-health-sector-strategic-investiment-plan-2013-to-2017.pdf
Ministry of Health. (2014a). 2013 Kenya Household Health Expenditure and Utilization Survey. Nairobi, Kenya. https://www.healthpolicyproject.com/pubs/745_KHHUESReportJanuary.pdf

Because of universal health coverage for accidents and acute care, private insurance uptake in NZ is low and accounts for 5-7% of health care costs a year (Ministry of Health, 2016; OECD, 2019). However, if a condition is a non-emergency condition, in the public system, people usually need to go through an assessment process and qualify for ‘elective’ treatment. Common elective treatments include hip or knee replacement, heart surgery, cataract removal, and diagnostic services such as endoscopy, laparoscopy, MRI scans, tonsillectomy, and grommets. Private health insurance helps with the cost of many non-urgent procedures and provides faster access to private hospitals for the treatment.
About one third of adults (35%) and 28% of children were covered by private health insurance in 2015 (Ministry of Health, 2016) with Māori and Pacific people less likely to report having private insurance. Most private health insurance (~80%) is paid for by the individual or a family member.
References:
Ministry of Health. (2016). Private Health Insurance Coverage 2011–15: New Zealand Health Survey. Ministry of Health website. Available from: https://www.health.govt.nz/publication/private-health-insurance-coverage-2011-15-new-zealand-health-survey.
OECD. (2019). Health at a Glance. OECD iLibrary. Available from: https://www.oecd-ilibrary.org/docserver/4dd50c09-en.pdf?expires=1590900931&id=id&accname=guest&checksum=BCC881772EE98968D2EB1E3A0E0684C2.

Access to private medical care is largely contingent on whether South Africans have access to medical insurance, for which only 17 of 100 persons (i.e., 12.7 million) are able to make use of these services (StatsSA, 2016, 2017a), providing services to only 16% of the population (Mahlathi & Dlamini, 2015). The sector consists of services provided by general practitioners, medical specialists, and private hospitals, and tend to be located in more urban areas (Mahlathi & Dlamini, 2015). This sector is largely under-regulated and has limited accountability at various levels (Competition Commission SA, 2018). In the absence of value-based purchasing, shortfalls include ineffective constraints on rising healthcare rates and insurance cover, while consumers are generally uninformed and disempowered (Competition Commission SA, 2018). The sector is furthermore characterised by a lack of integrated care models, with an enduring preference for solo practices and fee-for-services (FFS) billing that incentivises practitioners to provide more services than needed, especially in an unregulated pricing environment (Competition Commission SA, 2018).
Private healthcare in South Africa is extremely expensive and unaffordable for most of the population. Medical practitioners drive health care expenditures in the sector in two ways: (1) through their own activities (i.e., diagnosis and treatment); and (2) through referral for further investigation, treatment and hospitalisation (Competition Commission SA, 2018). The Competition Commission of South Africa found that despite rulings that doctors may not negotiate collectively, there are specialist groupings that operate collectively to resist joining service provider networks and introduce/adapt codes to inflate prices – without noticeable improvement in the quality of care offered. General practitioners form Independent Practice Associations (IPAs) that promote inclusion in preferred provider networks. These networks include quality assessments that are not publicly available, with no evidence of consequences for practitioners who do not meet standards (Competition Commission SA, 2018). Specialists join related (specialist) societies and associations, protecting their interests. Regulation within this sector is inadequate to inform and empower (and protect) the healthcare user.
References:
Competition Commission SA. (2018). Health market injuiry. Available from: http://www.compcom.co.za/wp-content/uploads/2018/07/Executive-Summary.pdf
Mahlathi, P., & Dlamini, J. (2015). MINIMUM DATA SETS FOR HUMAN RESOURCES FOR HEALTH AND THE SURGICAL WORKFORCE IN SOUTH AFRICA’S HEALTH SYSTEM: A rapid analysis of stock and migration. Available from: http://www.prographic.com/wp-content/uploads/2016/07/0316-south-africa-case-studies-web.pdf
StatsSA. (2016). General Household Survey. Available from: https://www.statssa.gov.za/publications/P0318/P03182015.pdf
StatsSA. (2017a). Public healthcare: How much per person? Statistics South Africa: Statistical Release. http://www.statssa.gov.za/?p=10548