DESK REVIEWS | 01.05.05. Stability![]()
DESK REVIEW | 01.05.05. Stability
Political stability index (-2.5 weak; 2.5 strong): the average value for Brazil between 1996 and 2017 was -0.15 points, with a minimum of -0.41 points in 2017 and a maximum of 0.33 points in 2002 (The World Bank, 2019).
References:
The World Bank. (2019). The World Bank Data. https://data.worldbank.org/indicator/NY.GDP.PCAP.PP.CD
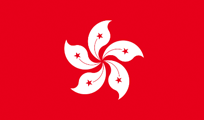
Political Stability indicator measures perceptions of the likelihood that the government will be destabilised or overthrown by unconstitutional or violent means, including politically motivated violence and terrorism. The measure ranges from approximately -2.5 (weak) to 2.5 (strong) governance performance. The World Bank provides data for Hong Kong from 1996 to 2017. The average value for Hong Kong during that period was 0.98 points with a minimum of 0.58 points in 1996 and a maximum of 1.34 points in 2005. In 2017, the Political Stability indicator was 0.85, which was in the middle rank (World Bank, 2017).
References:
World Bank. (2017). Worldwide Governance Indicators Retrieved from: https://databank.worldbank.org/source/worldwide-governance-indicators
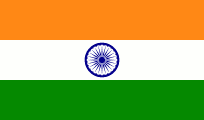
According to World Bank data on political stability, from the period 1996 to 2018, an average value of -1.13 points was reported for India (The Global Economy, 2019). A minimum -1.51 points was observed in 2003 and a maximum of -0.96 points was observed in 2018 (The Global Economy, 2019). India ranked 165th on the global political stability index in 2018 (The Global Economy, 2019).
References:
The Global Economy. (2019). Political stability by country, around the world |TheGlobalEconomy.com. Available from https://www.theglobaleconomy.com/rankings/wb_political_stability/
The World Bank indicator for political stability and absence of violence/terrorism ranks Indonesia at -0.5 in 2017. This shows a slight deterioration from the 2016 estimate (-0.4), but overall a trend towards more stability can be observed since 2008 (-.1.1) (World Bank, 2019c).
References:
World Bank. (2019c). Worldwide Governance Indicators. World Development Indicators. https://databank.worldbank.org/source/worldwide-governance-indicators/Type/TABLE/preview/on
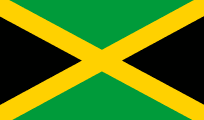
According to the World Bank 2017 aggregated measures, Jamaica appears to rank within the 50-60th percentile worldwide on the Political Stability and Absence of Violence/Terrorism scale.
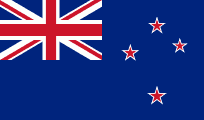
New Zealand is considered a stable country, scoring in the 93rd percentile for government effectiveness and above the 98th percentile for all other measures (Table 22) (World Bank, n.d.).
Table 22: NZ world Bank political stability indicators, 2018 (World Bank, n.d.)
| 2018: | Percentile (100 is best) |
| Voice and accountability | 99.51 |
| Political stability | 99.05 |
| Government effectiveness | 93.75 |
| Regulatory quality | 98.56 |
| Rule of Law | 98.08 |
| Control of corruption | 99.52 |
References:
World Bank. (n.d.). Worldwide governance indicators. The World Bank website. Available from: https://info.worldbank.org/governance/wgi/Home/Reports.
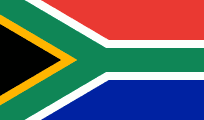
The World Bank describes South Africa’s political transition to a democratic country as ‘one of the most remarkable political feats of the past century” (The World Bank, 2018b). According to the Political Stability Index that collects data from The World Bank for 195 countries, South Africa ranked 122nd for the year 2017 with a score of -0.27 (-2.5 weak and +2.5 strong) (TheGlobalEconomy.com, 2018a). For the period 1996 to 2017, South Africa’s political stability scored an average of -0.14 points (min.-0.54 in 1998 and max. 0.22 in 2007) (TheGlobalEconomy.com, 2018b).
References:
The World Bank. (2018b). The World Bank in South Africa. Available from: http://www.worldbank.org/en/country/southafrica/overview
TheGlobalEconomy.com. (2018a). Political stability: Country rankings. Available from: https://www.theglobaleconomy.com/rankings/wb_political_stability/
TheGlobalEconomy.com. (2018b). South Africa: Political stability. Available from: https://www.theglobaleconomy.com/South-Africa/wb_political_stability/


