DESK REVIEWS | 01.03.01. Strength of the economy![]()
DESK REVIEW | 01.03.01. Strength of the economy
According to the World Bank metrics, Brazil is an upper middle-income country and one of the biggest economies in the world. In 2017, the GDP per capita (PPP – current international $), was 15,553.4 – representing a total economic turnover of 2,056 trillion USD. Comparatively, Mexico has 1.15 trillion USD and Argentina has 637.6 billion. Brazil has experienced a remarkable growth in the last decade, which made the country become the fifth largest economy in the world (The World Bank, 2019).
References:
The World Bank. (2019). The World Bank Data. https://data.worldbank.org/indicator/NY.GDP.PCAP.PP.CD
The economy of Hong Kong is a highly developed free-market economy characterised by low taxation, almost free port trade and well-established international financial market. In 2018, the GDP of Hong Kong is recorded at HK$2,845.3 billion with an annual growth rate of +5.9%. The GDP per capita is recorded at HK$381,870 with an annual growth rate of +5.1% (Census and Statistics Department, 2019c). Hong Kong has been classified as high-income by the World Bank (World Bank, 2019).
References:
Census and Statistics Department. (2019c). Hong Kong in Figures 2019 Edition. Hong Kong. Retrieved from https://www.statistics.gov.hk/pub/B10100062019AN19B0100.pdf
World Bank. (2019). Hong Kong SAR, China Retrieved from: https://data.worldbank.org/country/hong-kong-sar-china?view=chart
As per the World Bank categorisation, India is a lower-middle-income country. As the seventh largest economy in the world, in 2020, India had a Gross Domestic Product (GDP) of 2.6 trillion US dollars (World Bank, 2020a). Moreover, the GDP per capita in India was recorded as 1927 US dollars in 2020 (World Bank, 2020b).
References:
World Bank. (2020a). GDP per capita, India | Data. Available from https://data.worldbank.org/indicator/NY.GDP.PCAP.CD?locations=IN
World Bank. (2020b). India | Data. Available from https://data.worldbank.org/country/india
According to the World Bank, Indonesia is an emerging middle-income country and ‘the world’s 10th largest country in terms of purchasing power parity and an annual growth rate of 5.6% (Agustina et al., 2019, p.78; World Bank, 2019a). Since 1999, the poverty rate has reduced by more than half to 9.8% in 2018. Substantial progress has also been made with regards to GDP. Between the years 2000 and 2018, Indonesia’s GDP per capita steadily increased from $807 to $3,877 (World Bank, 2019a).
References:
Agustina, R., Dartanto, T., Sitompul, R., Susiloretni, K. A., Suparmi, Achadi, E. L., Taher, A., Wirawan, F., Sungkar, S., Sudarmono, P., Shankar, A. H., Thabrany, H., Susiloretni, K. A., Soewondo, P., Ahmad, S. A., Kurniawan, M., Hidayat, B., Pardede, D., Mundiharno, … Khusun, H. (2019). Universal health coverage in Indonesia: concept, progress, and challenges. The Lancet, 393(10166), 75–102. https://doi.org/10.1016/S0140-6736(18)31647-7
World Bank. (2019a). Indonesia. https://www.worldbank.org/en/country/indonesia/overview
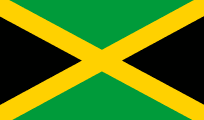
Jamaica’s GDP was estimated at $14.77 billion (official exchange rate), while the GDP – per capita (PPP) for the same year was estimated at $9,200.00 (CIA, 2019). According to the CIA World Factbook (2019), Jamaica’s economic growth reached 1.6% in 2016, but declined to 0.9% in 2017 following intense rainfall, which affected infrastructure and productivity. Economic growth is further impeded by the high unemployment rate which exacerbates the crime problem, along with gang violence fuelled by advanced fee fraud (lottery scamming) and the drug trade. The slow economic growth rate of on average less than 1% per year for the last three decades has also been accredited to high public sector corruption, bureaucracy, and high debt to GDP ratio.
However, the most recent Fiscal Policy Paper 2020-2021, reports that Jamaica has significantly improved under the IMF-supported Extended Fund Facility and Precautionary Stand-by programmes. Notably, Jamaica’s real GDP growth rate by the end of fiscal year 2017/2019 (Government of Jamaica, 2020). Growth is projected to be at .6% in 2020/2021.
Despite this growth and favourable projection, the economy is currently impacted by the COVID-19 pandemic. The Planning Institute of Jamaica (PIOJ) projects that for fiscal year 2019/2020, growth of the Jamaican economy will decline by 0.6% in light of COVID-19 (PIOJ, 2020).
References:
CIA World Factbook. (2019). Jamaica. https://www.cia.gov/the-world-factbook/countries/jamaica/
Government of Jamaica. (2020). Fiscal Policy Paper 2020-2021. Ministry of Finance and the Public Service. Available from: https://www.mof.gov.jm/wp-content/uploads/fiscal-policy-paper-2020-21-140220.pdf
Planning Institute of Jamaica (PIOJ). (2020). The Planning Institute of Jamaica’s Review of Economic Performance, January–March 2020. Media Brief, May 27th, 2020. https://www.pioj.gov.jm/wp-content/uploads/2020/05/DGs_QPB_244-speaking-notes-revised-27-5-20-FINAL_1.pdf
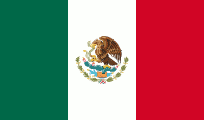
Mexico is among the ten largest countries in the world, it is the second largest economy in Latin America after Brazil. It ranks as the 15th world economy, according to its Gross Domestic Product (GDP) at exchange rate, and the 11th in terms of GDP at Purchasing Power Parity (PPP). It has been classified as an upper middle-income country by the World Bank (CEPAL, 2018; OECD, 2017a; Banco Mundial, 2019). The Mexican currency is the Mexican Peso (MXN) and the current exchange rate by the Central Bank as of 18 January 2019 is 19.1 pesos per USD and 21.7 pesos per Euro (Banco de México, 2018).
Mexico has an open economy, oriented to exports and highly regulated free trade agreements with more than 40 countries including the European Union, Japan, Central and South America, as well as the North American Free Trade Agreement (NAFTA) with the United States and Canada, which is currently under revision and negotiation. This has put Mexico within the highest 10 export economies in the world. The country’s growth is projected to increase from 2.0% in 2017 to 2.2% in 2018 and 2.5% in 2019, supported by higher US growth. However, the growth forecast was lower than expected in April 2018, reflecting the impact on investment and domestic demand of prolonged uncertainty related to trade (International Monetary Fund, 2018).
While Mexico has been a member of the OECD since 1994, its per capita Gross National Income is the lowest among the Organisation for Economic Co-operation and Development (OECD) members –58% below the OECD average in 2016, in terms of Purchasing Power Parity. Compared to upper middle-income countries (UMICs), however, Mexico’s per capita Gross National Income (GNI) is 7% above the average of that group (The World Bank, 2019).
References:
Banco de México. (2018). Mercado cambiario, tipo de cambio, Banco de México.
Banco Mundial. (2019). México: proyectos.
CEPAL. (2018). Estudio Económico de América Latina y el Caribe, 2018 (LC/PUB.2018/17-P).
International Monetary Fund. (2018). World Economic Outlook Challenges to Steady Growth.
OCDE. (2017a). Estudios Económicos de la OCDE México (OCDE Publishing, Ed.). OCDE Publishing. https://www.oecd.org/eco/surveys/mexico-2017-OECD-Estudios-economicos-de-la-ocde-vision-general.pdf
The World Bank. (2019). Mexico Data. https://data.worldbank.org/country/mexico
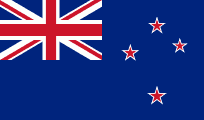
New Zealand is categorised by the World Bank as a high-income country (The World Bank, 2019). Gross Domestic Product for the country as of December 2019 was NZD311 billion with an annual growth rate of 2.3%, equating to a per capita GDP of NZD62,000 (~USD37,000) (Statistics NZ, 2020).
References:
Statistics NZ. (2020). Gross domestic product: December 2019 quarter. New Zealand Government Website. Available from: https://www.stats.govt.nz/information-releases/gross-domestic-product-december-2019-quarter.
The World Bank. (2019). New Zealand. The World Bank website. Available from: https://data.worldbank.org/country/NZ.
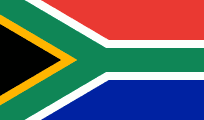
The South African GDP per capita (PPP, purchasing power parity) is recorded as US$12 294.88 in 2017. GDP decreased by 0.7% in the second quarter of 2018, with the largest negative contributors being agriculture (-0.8, i.e., decreasing by 29.2%), transport (-0.4, i.e., decreasing by 4.9%), and trade (-0.3, i.e., 1.9%) (StatsSA, 2018a). Positive contributions primarily came from the mining (0.4, i.e., increasing 4.9%) and finance, real estate and business service industries (1.9%) (StatsSA, 2018a). The third quarter in 2018 saw the Real GDP (measured by production) increasing by 2.2% for which the largest contributors to growth were the manufacturing (7.5%, contributing 0.9 of percentage point to GDP), finance (2.3%, 0.5 percentage point), and transport and trade industries (5.7%, 0.5 percentage point) (StatsSA, 2018b). These figures have been significantly affected by the COVID-19 pandemic and associated lockdowns with a reduction in productivity and increase in unemployment by 2021.
The World Bank categorises South Africa as an Upper-middle-income country (The World Bank, 2018a). South Africa is one of the most unequal countries in the world and this categorisation by the World Bank is not what most of the South Africans experience in terms of their living conditions.
References:
StatsSA. (2018a). Gross Domestic Product: Second Quarter. In Statistics South Africa: Release date 04 September 2018. https://doi.org/10.1080/00128775.1994.11648537
StatsSA. (2018b). Gross domestic product: Third quarter. Available from: https://www.statssa.gov.za/publications/P0441/P04413rdQuarter2018.pdf
The World Bank. (2018a). Overcoming Poverty and Inequality in South Africa:An Assessment of Drivers, Constraints and Opportunities. Available from: https://documents.worldbank.org/en/publication/documents-reports/documentdetail/530481521735906534/overcoming-poverty-and-inequality-in-south-africa-an-assessment-of-drivers-constraints-and-opportunities

